Physics Toolbox
by Vieyra Software
LESSONS: All Lessons
The majority of lesson ideas below require minimal resources other than the smartphone, and are relevant to introductory physics in high school and college. However, creative individuals are using smartphone science in more complex ways, with drones, engineering kits, and much more. Follow us on Twitter @PhysicsToolbox and see our Publications page for additional content.

Introduction to Smartphones as a Teaching Tool
What are some examples physics topics that can be taught with smartphones?
Try This
Click on the resources below to get some sample worksheets intended for practicing physics teachers to learn about some (but not all) of the capabilities for using smartphones in physics teaching in the context of a 2-hour professional development workshop setting.
Related Resources

Introduction to Smartphone Sensors
What sensors are available in a smartphone, and what do they measure?
Try This
Download Physics Toolbox Play and complete the 7 challenges to learn about the basic smartphone sensors, what they measure, some fundamental physics, and how sensors are used in STEM careers.
Related Resources

Measuring Heights
What is the HEIGHT of any structure?
Try This
To measure the height of a tall object, think about the height as the side of a right-triangle. Standing a good distance away from the object, use the Orientation tool to determine the angle between the horizontal and your line of sight to the top edge of the object. To get the base of the triangle, measure the number of steps between you and the base of the object. (You can find out the length of each of your steps separately using a meter stick). This requires some understanding of trigonometry.
Related Resources

Circumference of the Earth
What is the circumference of the Earth?
Try This
Use either equinox to your advantage to measure the circumference of the Earth using a method similar to that used by Eritosthenes! On the Equinox at astronomical noon, the sun is directly overhead at the equator (where the latitude is 0 degrees). At a point not on the equator, use the GPS to determine your latitude and the Inclinometer to determine the angle of the sun at astronomical noon at your location. Considering that the Earth makes up a full 360 degrees around, use the known difference in latitude from the equator, the known distance per latitude degree, and the difference in inclination of the Sun to determine the total distance around the Earth (approximated for the Earth as a perfect sphere).

Precision and Accuracy
What is the PRECISION of our measurement tools?
Try This
Try to measure a small object (such as a leaf or coin) using various tools, including the Ruler mode. To what decimal value does the app provide? (Considering that the smartphone uses pixels, is the measurement actually that precise? Consider how smartphones make estimates about finger position). In reality, what is more accurate and precise, the smartphone or another tool?

Gait Patterns
What is the relationship between the HEIGHT and GAIT FREQUENCY for walking humans?
Try This
Try This
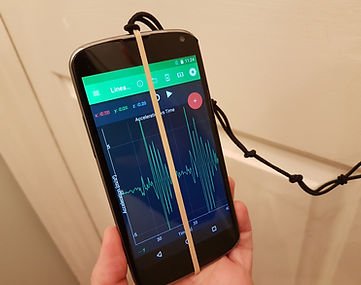
Attach a mobile device to your back or chest area and collect data while walking using the g-Force or Accelerometer tools. For various subjects, compare dynamic, gait, metrics, symmetry, and variability. Compare these traits in the data to physical characteristics, such as height or leg length. If desired, record video on another camera to compare data to visual observations.
Challenge Yourself
-
Create a graph of Gait Frequency vs. Height, and derive a mathematical expression for this relationship.
-
If there are any constants in these mathematical expressions, explain their significance.
-
Attach the mobile device to other parts of the body (thigh or leg). How does this data differ from that collected on your chest or back? Why?
Related Resources
-
Lesson Plan from Teach Engineering: "Identifying Gait Metrics." [External website]

Seismic Vibrations
What is the relationship between SEISMIC VIBRATION STRENGTH and DISTANCE from the "epicenter" of the shake?
Try This
Perform three different investigations from IRIS (Incorporated Research Institutes for Seismology). In these activities, use the Accelerometer tool along with a meter stick, tape, and chair or water bottle to simulate the relationship between an earthquake's magnitude and intensity. Calculate the energy released during a weight drop (magnitude) and use the accelerometer to investigate what happens to the energy as the source is moved further and further from the sensor (intensity). Examine USGS ShakeMaps to explore other factors besides event size and distance from the source to the receiver that affect the intensity (i.e. geologic structures and materials).
Challenge Yourself
-
Create a graph of Intensity vs. Distance for a "seismic event," and derive a mathematical expression for this relationship.
-
If there are any constants in this mathematical expression, explain their significance.
Related Resources
-
Lesson Plan from IRIS. "How are Magnitude and Intensity Different?" [External website]
-
Lesson Plan from IRIS. "Exploring Three-Component Seismic Data with Accelerometers." [External website]
-
Lesson Plan from IRIS. "How Hard Does the Ground Shake During an Earthquake?" [External website]

G-"Forces"
Under what circumstances do G-FORCES read "0" in all dimensions? Why?
Try This
Although used in everyday speech to describe changes in motion, a "g-force" is neither a measure of gravity nor a force! Instead, g-force can be thought of as the unit-less ratio between normal force on an object and its weight (FN/Fg). For example, someone who is experiencing "2 g's" is experiencing a normal force that is twice the strength of the pull of gravity on their body, and the increased normal force is perceived as "apparent heaviness," although there is no actual change in weight.
Investigate g-forces in all dimensions by using the G-Force tool. Try orienting the smartphone or tablet differently, and seeing the effect on the total and individual g-force axes. Try to get the device to read - if only temporarily - a g-force of 0 in all dimension at the same time. Hint: The best place to try this is on a large, padded area such as a bed or sofa. (Be cautious of preventing your phone from colliding with hard surfaces, or bouncing off of a soft surface.)
Challenge Yourself
-
Describe the kind of motion that is necessary for all axes to read "0" g-force. Explain why this is the case.
-
Describe the kind of motion that would be necessary for all axes to read "1" g-force. Explain why this is the case.
-
For a device at rest, is it ever possible for the total g-force to be higher or lower than 1-g? Explain.
Related Resources
-
Article from The Science Teacher. "Turn Your Smartphone into a Science Laboratory." [External website]

Describing Acceleration with a Tin Pan
What is the relationship between the POSITION of objects and the TIME they take to fall?
Try This
Attach 6 or more hex nuts with uniform spacing, using a ruler, to a single strand of string, suspend the string vertically from one end, and then drop it onto a pie pan. Listen to the pattern of the sound produced. What does this suggest about the motion of things as they fall? Try to re-position the hex nuts along the string so that the sound produced is a uniform series of beats (equal time intervals). Using the Sound Meter mode of Physics Toolbox Suite, record these sounds, and refine your spacings until the time intervals are as uniform as possible.
Challenge Yourself
-
What do you notice about the physical spacing between each of the nuts in order to produce a uniform series of beats?
-
Create a graph of Distance of each hex nut (from the first hex nut) versus the beat number. What mathematical model describes the curve produced?
Related Resources

Acceleration Due to Gravity
What is the ACCELERATION DUE TO GRAVITY near the surface of the Earth?
Try This
Try This
Using the Accelerometer tool, allow the mobile device to fall straight down onto a soft surface, such as a bed, sofa, or very large pillow. Using the data recorded, determine the acceleration due to gravity near the surface of the Earth.
Challenge Yourself
-
Is the acceleration due to gravity recorded as positive or negative on your device? Why?
-
Is the acceleration of devices of different mass and size the same or different? Why?
Related Resources
-
Article from Mobile Science Wiki. "Intro to Accelerometer, Measurement of g" (with a drop) [External website]
-
Article from The Science Teacher. "Turn Your Smartphone into a Science Laboratory." [External website]

Displacement, Velocity, and Acceleration
What is the vertical DISPLACEMENT traveled during an elevator ride?
Try This
Few mobile devices have the capability to measure small-scale displacements inside of buildings - when it is measured, it is typically done through comparing GPS coordinates. However, another method is to use "dead-reckoning." In this case, a simple example of linear dead-reckoning can be accomplished by taking the double integration of acceleration data.
While using the Accelerometer tool on a mobile device that is lying flat on the floor of an elevator, ride up or down a reasonable number of levels. Export this data as a .csv file into a data analysis program, such as Logger Pro, Data Studio, or Excel. Take the double integral of the data from the moment you started accelerating at the start of the ride to the moment you stoppped accelerating at the end of the ride. This double integration gives the displacement of the elevator. If possible, compare this double integration to a physically measured value (i.e. counting and measure stair steps) to evaluation.
Challenge Yourself
-
If you went up in your elevator ride, how would your results (graph, integral, and total displacement) be different if you went down?
-
How would the results above be different if your mobile device was oriented differently? Explain.
-
What is the percent error in your double integration compared to the physically measured displacement? Explain what factors might account for these differences.
Related Resources
-
The Physics Teacher. "Relating Time-Dependent Acceleration and Height Using an Elevator."
-
Nuevas Tecnologies en la Ensenanza de la Fisica. "Ascensor en Subida o Bajada."
Springs and Period of Oscillation
What is the relationship between MASS and PERIOD of an oscillating spring?
Try This
Using the Accelerometer tool, record the period of oscillation of your smartphone when attached to a vertical spring. Determine the graphical and mathematical relationship between mass and period of the spring. (If a spring is not available, a set of uniform rubber bands will suffice). Known masses can be attached to the mobile device, and additional objects can be massed using a balance. Determine the effect of using different uniforma sets of rubber bands.
Challenge Yourself
-
Create a graph of Period vs. Math, and derive a mathematical expression for this relationship.
-
If there are any constants in these mathematical expressions, explain their significance.
-
The "type" of spring affects the quantitive relationship of mass and period by a factor known as the "spring coefficient." Do thicker, stiffer rubber bands results in a higher or lower spring coefficient? Explain how you know.
-
Predict the unit(s) associated with the spring coefficient by doing unit analysis. Explain.
Related Resources
-
Mobile Science Wiki. "Harmonic Oscillation" video.
-
IoP Science. "Oscillations Studied with a Smartphone Ambient Light Sensor."
Spring Systems
What is the relationship between effective SPRING CONSTANT and SPRING SYSTEMS (series/parallel)?
Try This
Try This
Using the Accelerometer tool, record the period of oscillation of your smartphone when attached oscillating springs in a series or parallel configuration. Determine the effective spring constant in each scenario.
Related Resources

Pendula and Periods of Oscillation
What is the relationship between LENGTH, MASS, and PERIOD of a simple pendulum?
Try This
Using the Proximeter tool, measure the period of a simple pendulum constructed from a suspended string attached firmly to the mobile device. Use a meter stick to determine the relationship between pendulum length and period (if any). Use a balance to determine the relationship between the pendulum mass and period (if any).
Challenge Yourself
-
Create a graph of Period vs. Mass, and derive a mathematical expression for this relationship.
-
Create a graph of Period vs. Length, and derive a mathematical expression for this relationship.
-
If there are any constants in these mathematical expressions, explain their significance.
-
Does the angle of release have any impact on the pendulum? Explain how you know.
Related Resources
-
Eureka Magazine. "Obtaining Acceleration Due to Gravity with a Pendulum."
-
Mobile Science Wiki. "Measurement of Acceleration of Gravity and Angle of Release."
-
* Note: The lesson plan above refers to a "Mobile Science Pendulum" app, and is no longer available. However, this lab can be fully completed with Physics Toolbox Accelerometer alone and with or without any data analysis tool that can accept .csv files. Essentially, the app, developed by Forinash and Wisman, used Physics Toolbox Magnetometer to directly export data into a data analysis tool. Vieyra Software hopes to soon have direct data analysis capabilities in the future.*

Inertial Balance
What is the relationship between MASS and PERIOD of an oscillating inertial balance?
Try This
Using the Accelerometer tool, measure the period of an oscillating inertial balance (either commercially obtained or fashioned out of two electrical boxes, metal strips, and screws) and masses.
Challenge Yourself
-
Create a graph of Period vs. Mass, and derive a mathematical expression for this relationship.
Related Resources
-
Asael Barrera-Garrido. "A Smartphone Inertial Balance."


Locating an Accelerometer with Circular Motion
Where is the ACCELEROMETER located in my smartphone?
Try This
Measure the centripetal acceleration on a smartphone using the Accelerometer tool when placed on a record player moving at a constant speed. Determine the location of the accelerometer from the acceleration reading and the radius, measured with a meter stick.
Challenge Yourself
-
How would the experiment be different if the speed of the record player was uniformaly faster or slower? Explain.
Related Resources
-
Science on Stage iStage: "Measuring the World Around Us." See pages 55-59.
-
The Physics Teacher. "Locating a Smartphone's Accelerometer."
-
The Science Teacher. "Turn Your Smartphone into a Science Laboratory."
-
The Science Teacher video introduction. Video.

Measuring Height and Vertical Speed with Air Pressure
What is the relationship between the PRESSURE and HEIGHT above ground?
Try This
Using the Barometer tool, determine the relationship between air pressure and height above ground. A meter stick can be employed to determine the height above ground (by measuring and counting the heights of stair steps, for example).
Related Resources
-
Student worksheet from Vieyra Software Measuring Height with Pressure
Forces on an Inclined Plane
What is the relationship between the INCLINE ANGLE and FORCES on an object placed on an inclined plane?
Try This
Using the G-Force and Orientation tools, determine how the components of the forces acting on an object change as the angle of incline changes,
Related Resources

Liquid Pressure and Stevin's Law
What is the relationship between PRESSURE and DEPTH below the surface of a liquid?
Try This
Using the Barometer tool, place the smartphone inside of a water-proof case and submerge it under a still container of water. Use a meter stick to measure the depth of the device below the surface. Determine the relationship between pressure and depth for water. Perform the same experiment with different fluids (soap, saturated salt water, oil, alcohol, etc.)
Challenge Yourself
-
Create a graph of Pressure vs. Depth for water, and derive a mathematical expression for this relationship.
-
Create additional graphs of Pressure vs. Depth for other fluids, and derive mathematical expressions for these relationships.
-
If there are any constants in these mathematical expressions, explain their significance.
-
Using prior understandings about fluid pressure, determine the density of each fluid studied.
Related Resources
Air Pressure in a Balloon
What is the relationship between PRESSURE and RADIUS of an inflated rubber balloon?
Try This
Using the Barometer tool, place the smartphone inside of a spherical translucent latex balloon. (Alternatively, us an app such as Airmore to display Physics Toolbox on your computer via a bluetooth connection). Inflate the balloon, and periodically measure the radius of the spherical balloon using a meter stick.
Challenge Yourself
-
Create a graph of Pressure versus Radius. and derive a mathematical expression to model the relationship.
-
If there are any constants in these mathematical expressions, explain their significance.
Related Resources
Investigating Elements of Bernoulli's Principle
What is the relationship between PRESSURE and DEPTH below the surface of a liquid?
Try This
Using the Barometer tool, place the smartphone inside of a "wind tunnel" constructed from PVC tubes and a hair dryer. Observe changes in pressure as a result of changes in tunnel radius.
Related Resources
-
Physics Education. "A Simple Wind Tunnel to Analyze Bernoulli's Principle."
Newton's Laws with an Atwood's Machine
What is the relationship between MASS, NET FORCE, and ACCELERATION for an object?
Try This
The relationship between mass, net force, and acceleration of an object is frequently displayed using an Atwood's Machine (two masses suspended over a pulley system) or a modified Atwood's Machine (one mass suspended over a pulley system, pulling on a frictionless object over a horizontal surface).
Using the Accelerometer tool, place the mobile device in a plastic bag and suspend it from a traditional or modified Atwood's Machine composed of pulleys and string. Using known masses and mass of the mobile device using a balance, determine the net force on each object. Use the data to determine the acceleration. Perform experiments in which acceleration is measured resulting from changes in mass and net force on the system.
Challenge Yourself
-
Create a graph of Net Force vs. Acceleration, and derive a mathematical expression for this relationship.
-
Creat a graph of Mass vs. Acceleration, and derive a mathematical expression for this relationship.
-
If there are any constants in the mathematical expressions above, explain their significance.
-
Combine the two expressions into a single expression.
-
Using the expression and a new system of given mass, estimate the expected acceleration. Compare to the actual acceleration observed using the smartphone data.
Related Resources
-
The Science Teacher. "Turn Your Smartphone into a Science Laboratory."

Newton's Laws with an Elevator Ride
How does the NORMAL FORCE on my body change during an elevator ride?
Try This
Use the Accelerometer tool and place the mobile device flat on the floor of an elevator during a ride up and a ride down. Use a body scale to determine your mass. For each part of the elevator ride (accelerating up, moving up at constant velocity, accelerating down on the way up, etc.), draw a quantitative force diagram for your body by calculating the net force, normal force, and weight acting on you.
Challenge Yourself
-
Complete the worksheet listed below in "Resources."
-
How would this experience be different if you were on another planet, or if you weighed more?
Related Resources
-
Rebecca Vieyra. "Elevator Ride Scale Reading."
-
The Science Teacher. "Turn Your Smartphone into a Science Laboratory."
-
Revista Brasileira de Ensino de Fisica. "Medindo a Aceleracao de um Elevador."

Gas Pressure and Speed in an Elevator
What is the speed of an elevator shaft?
Try This
Using the Barometer tool, measure changes in atmospheric pressure up and down a long elevator ride. Using Stevin's Law, which relates fluid pressure and depth (or altitude), determine the displacement of the elevator in the given time, and calculate average velocity during the constant velocity portion of the ride.
Challenge Yourself
-
Create a graph of Pressure vs. Time for a ride up and down the elevator.
-
Perform column calculations to create a graph of Position vs. Time
-
From the Position vs. Time graph, determine the average velocity of the elevator during each major segment of motion (going up at a constant speed, going down at a constant speed, stopped).
-
Collect accelerometer and barometer data at the same time (in Multi Record mode), and compare the graphs of Position vs. Time, Velocity vs. Time from the barometric data and the Acceleration vs. Time from the accelerometer data.
Related Resources
Potential and Kinetic Energy of a Pendulum
What is the relationship between POTENTIAL ENERGY and KINETIC ENERGY of a simple pendulum?
Try This
Using the Accelerometer tool, fix the smartphone to the end of a simple pendulum made from a string attached to a point. Before releasing the pendulum from a given height (measured from the bottom of the pendulum swing), determine the potential energy using the mass of the smartphone and a ruler. Release the smartphone. Using data from the acceleration when at the lowest point, determine the tangential velocity at the lowest point (and hence, the kinetic energy).
Challenge Yourself
-
How did the starting potential energy at the top of the swing compare to the kinetic energy at the bottom of the swing?
-
How would this relationship differ if potential energy had been measured from the ground, and not from the bottom of the pendulum swing? Why?
-
Draw energy pie charts for systems in which potential energy is measured from both frames of reference.
Related Resources

Impulse in Collisions
How well do different materials decrease the FORCE OF IMPACT between two objects?
Try This
Using the Accelerometer tool, determine which bumper materials decrease the average force of impact on a cart rolling down an inclined plane into a barrier.
Challenge Yourself
-
Which material most decreased the force? Why?
-
Would it be beneficial for the bumper and the barrier to have material properties that caused the cart to bounce? Why or why not?
Related Resources
-
Calderglen Physics. "Crumple Zone Experiment."

Amusement Park Physics
Amusement Park Ride Analysis
Try This
Use the Accelerometer, Barometer, and/or Roller Coaster tools to investigate G-forces, acceleration, and circular motion on a variety of amusement park rides.
Related Resources
-
Smartphone Physics at Amusement Parks Blog
-
Physics Education. "Aerodynamics in the Amusement Park: Interpreting Sensor Data for Acceleration and Rotation."
-
Physics Education. "Rotating Swings: A Theme with Variations."

Gas Laws in a Refrigerator
What is the relationship between the TEMPERATURE, PRESSURE, and RELATIVE HUMIDITY of a constant volume of air?
Try This
Place a smartphone inside of a sealed jar while recording data on the Barometer, Thermometer, and Hygrometer tools. Place the jar inside of a refrigerator or freezer for a few minutes. Analyze the data and describe the changes in all of the variables throughout the experiment.
Related Resources - Click the image to get a lesson plan!
Related Resources
-
Student worksheet from Vieyra Software Gay Lussac's Law
-
The Physics Teacher. "Kitchen Physics: Lessons in Fluid Pressure and Error Analysis."
-
Alfonso d'Ambrosio. "Experimenti con Microbit et Scratch: il sensore di temperatura dal frigorifero all'asiugacapelli."

Surface Waves and Couder Spheres
What do physical WAVES look like?
Try This
Use the Tone Generator, a speaker, and a small tray of liquid to observe Faraday waves and Couder spheres.
Related Resources
Waveforms Produced by Sound
What kind of WAVEFORMS are representative of HIGH/LOW PITCH and HIGH/LOW VOLUME?
Try This
Use the Oscilloscope to observe waveforms for produced by simple tones (such as tuning forks) and more complex sounds (such as your voice).
-
Draw a sketch for a high/low frequency sound
-
Draw a sketch for a high/low amplitude sound
-
Compare sounds of the same tone that have a different timbre

Natural Resonance of Sound
What is the relationship between resonant FREQUENCY of a bottle and the LENGTH of the resonating air column? (or the PROPERTIES of a resonating rod?)
Try This
Acquire a bottle with a small mouth that can easily resonate by blowing over it. Using the Tone Detector tool, record the resonating frequency produced by the bottle. Record the pitches produced in the bottle at various length (measured with a meter stick) modified by adding or removing water from the bottle. (It is also possible to study the physical properties of resonating rods, including their density/material, length, and Young's Modulus value).
Challenge Yourself
-
Create a graph of Frequency vs. Length of the resonant column of air, and derive a mathematical expression for this relationship.
-
If there are any constants in this mathematical expression, explain their significance.
-
Try the experiment again, and do this instead with a resonating wine glass, using your wetted finger to make the glass resonate. (Note: In the case of wine glass resonance, it is the actual glass - not the column of air - that resonates). Consider how it might be appropriate to measure the variable in question. Try this with glasses of various shapes, sizes, and thicknesses.
Related Resources

Forced Resonance of Sound
How many harmonics can be created in a straw?
Try This
Use the Tone Generator at around 800 Hz. Submerge one end of a large straw (such as a "Giant Pixie Stick" straw) into a cup of water so that you can easily modify the length of the closed-end tube. Place the smartphone speaker near the end of the open part of the tube. What length of tube is necessary to generate resonance? Why?
Challenge Yourself
-
How many harmonics can be created in a straw with only one tone?
-
What happens to the necessary length of tube as the frequency of the Tone Generator is increased/decreased?
Related Resources

Interference
What is the relationship between POSITION between two sound sources and INTENSITY?
Try This
Use the Tone Generator tool on a single smartphone with attached earbuds at 3440 Hz. Separate the earbuds by about 40 cm, and fasten them to a meter stick. Pull the meter stick with the attached earbuds along the length of your ear. What do you hear? Do the same, but pull it along the microphone of another smartphone that records the intensity with the Sound Meter tool. You will notice that the sound intensity increases and decreases multiple times along the length between the earbuds. Why?
Challenge Yourself
-
What happens to the interference pattern when the frequency is higher or lower? Why?
Related Resources

Beats
What is the relationship between TWO FREQUENCIES played at once and the observed BEAT?
Try This
Use the Tone Generator tool on two different smartphones (ideally, they should be similar phones, so that the microphones are as similar as possible).
Related Resources
-
Student worksheet from Vieyra Software Beats

What is the speed of sound in air?
Speed of Sound in Air
Try This
Use the Tone Generator tool to cause resonance in a column of air. Use the Oscilloscope to visually observe resonance. Determine the speed of sound in air by measuring the length of a fraction of a wave as it resonates in a column.
Related Resources
-
Student worksheet from Vieyra Software Speed of Sound in Air
Image provided by https://t.co/96hM9HtwKL

Ambient Noise
How loud is my environment?
Try This
Using the Sound Meter tool, measure the average intensity of ambient noise to determine the level of noise pollution that surrounds you. Record values in quiet and loud environments, and compare these values to charts online to determine if hearing damage might result in particular environments.
Challenge Yourself
-
What is the quietest environment that you can possible find?
-
What is the loudest environment that you found?
Related Resources
-
Science on Stage iStage: "Noise Pollution." See pages 32-37.

Noise Insulators
What types of MATERIALS block out sound waves?
Try This
Using the Sound Meter tool, construct a sonically insulated box using any materials available to you.
Challenge Yourself
-
What materials are best at insulating noise? Why?

Natural Scale
What is the relationship FREQUENCY and NOTE number in the natural scale?
Try This
Using an instrument, play through at least two full octaves of the natural scale. For each note, record the frequency using the Tone Detector or Wave Analyzer.
Challenge Yourself
-
Observe the difference in frequency from note to note. What is the pattern in change of frequency from note to note (if any?)
-
Plot a graph of frequency versus note number. What is the relationship?

Harmonics
What is the relationship FREQUENCY and HARMONIC number?
Try This
Play a note on an instrument. Observe the FFT graph produced by the Spectrum Analyzer mode.
Challenge Yourself
-
Record the main frequency of the note "fundamental," as well as the frequencies of any harmonic(s) produced while the note is played.
-
Compare the frequency of the fundamental to the frequency of the harmonic(s).

Sound Intensity
What is the relationship between the SOUND INTENSITY and DISTANCE from a point source of sound?
Try This
Create a constant sound source by using the Tone Generator tool on one mobile device. Record the sound intensity with another mobile device by using the Sound Meter tool. Using a meter stick, measure how the sound intensity changes as a function of distance from the sound source.
Challenge Yourself
-
Create a graph of Sound Intensity vs. Distance from the sound source, and derive a mathematical expression for this relationship.
-
If there are any constants in this mathematical expression, explain their significance.
-
How would this experiment be different if the tone produced was louder or had a different frequency? Explain.

Color by Addition
What do projected COLORS of light look like when mixed?
Try This
Using the Color Generator tool on two or three mobile devices, try mixing light by shining the screens in a darkened room onto a white surface. Mix projected red and blue, red and green, blue and green, and red/blue/green. Describe how these mixed colors are different from mixing pigments.
Related Resources
-
Student worksheet from Vieyra Software Color by Addition
Color by Reflection
What do PIGMENTED OBJECTS look like under monochromatic lights?
Try This
The color of light sources influences the way we perceive objects. For example, if the sun was truly only pure yellow, we would only see the world in shades of yellow! The fact that we can see objects of a full rainbow of colors suggests that the sun, is, indeed, producing the full visible spectrum of light.
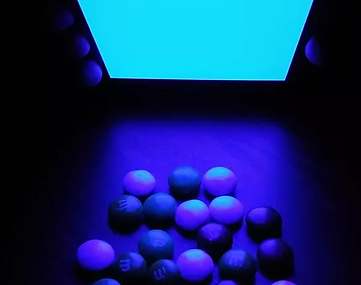
Use the Color Generator tool to produce a single color of light, such as red. In a completely darkened room, shine the pure red screen down on a set of colored candies, Lego blocks, or beads (simple colors work best, such as red, blue, green, and yellow). Attempt to sort the items into similarly-colored groups. Then, turn on the ambient light and see how successful you were! Mix up the candies, and try again with pure blue and green, and then secondary colors of light (yellow, magenta, and cyan). Keep track of which colored candies are easiest to sort under which colors of light, and come up with a potential explanation for why this is the case.
Challenge Yourself
-
Complete the student worksheet listed in "Resources" below.
-
Attempt to predict the colors that a given color of candy will appear to your eye when observed under a specific color of light.
-
Using a print-out of the South African flag, sketch what you expect the flag will look like under white, red, blue, green, yellow, magenta, and cyan light.
Related Resources
-
Rebecca Vieyra. "M&M's Color Sorting Lab."
-
Bree Barnett-Dreyfus: "Color Subtraction: Reflected Color"

Light Intensity
What is the relationship between the LIGHT INTENSITY and DISTANCE from a point source of light?
Try This
In a completely darkened room, create a light source by turning on the flash on one mobile device. Record the light intensity with another mobile device by using the Light Meter tool. Using a meter stick, measure how the light intensity changes as a function of distance from the light source.
Challenge Yourself
-
Create a graph of Light Intensity vs. Distance from the light source, and derive a mathematical expression for this relationship.
-
If there are any constants in this mathematical expression, explain their significance.
-
How would this experiment be different if the light source was bigger or brighter/dimmer? Explain.

UV Absorption
Do my sun glasses actually block out UV light?
Try This
Acquire one or more sets of sunglasses that are rated to block out UV light. Using the UV tool, determine compare the UV reading outside under the sky, versus the UV reading when covered by a single lens of the sunglasses. Determine what percentage of UV is blocked by the glasses. Using sunglasses without UV protection, determine if any UV is blocked at all.
Challenge Yourself
-
Compare UV readings of the sky at various times throughout the day.
-
Compare UV readings under clear or overcast sky when the sun is at the same height. Do clouds block UV light?

Color by Subtraction
What colors of LIGHT get absorbed by various FILTERS?
Try This
Although it is common for people to believe that light is "colored" when passing through a filter, this is not the case. It is more effective to think about colors as getting absorbed through filters (considering that white light is a combination of many colors).
Using the Color Generator tool, place a variety of primary colored gummy candies on the screen of a single color. Observe which gummy candies, acting as filters, allow which colors to get through. After describing a working model for how different primary colors of light absorb or are transmitted, predict what colors will be observed through the gummy candies for a screen that produces secondary light.
Challenge Yourself
-
Predict what colors of light will be observed through a gummy candy that appears to be a secondary color of light (i.e. yellow). Explain how you came to your conclusion, and the test it to check.

Seasons and Flux
What causes the seasons?
Try This
Use the Light Meter to model flux experienced at various points on the surface of the Earth. Prepare a globe with an equator, and hold at an angle with respect to a parallel sun or light source. Observe changes in the light intensity experienced by the smartphone, held tangent to the surface, in the north and south hemispheres.
Challenge Yourself
-
For an earth and the light source both in a plane parallel to the "ground," plot the relationship between latitude and light intensity.
-
Explain how this graph would look different if the globe was titled differently (i.e. if the equator was always parallel to the sun, or if the equator was vertical to the ground).
Related Resources

Albedo
How does light REFLECTION and ABSORPTION influence CLIMATE CHANGE?
Try This
Use the Light Meter tool to compare the reflectivity of various types of surfaces representative of different types of ground cover: snow, water, vegetation, sand, etc.
Challenge Yourself
-
Predict which types of ground cover produce greater reflectivity.
-
Consider how ground cover might change if the Earth were to heat up or cool down, and what effect this would have on albedo and environmental feedback loops.
-
Using a more specialized app such as Albedo; A Reflectance App, and a gray card, perform more detailed analyses of specific reflectivities of red, blue, and green light.
Related Resources
-
Alfonso D'Ambrosio: "Global Warming: A Poor Laboratory Activity on Albedo Using a Smartphone" (translate from Italian)
-
Bree Barnett-Dreyfus: "Color Subtraction: Reflected Color"

Eclipses, Transits, and Exoplanet Detection
How do astronomers detect EXOPLANETS?
Try This
Using the Light Sensor tool, model the eclipsing of exoplanets in front of their stars. Use changes in light intensity, as observed from a distance, in order to determine the period of rotation of the exoplanet, its size, and its diameter.
Challenge Yourself
-
How is this model similar to / different from the way astronomers actually identify exoplanets?
Related Resources
Polarized Light and Malus' Law
What is the relationship between LIGHT INTENSITY and ANGLE for polarized light observed through a polarizer?
Try This
Using the Light Sensor and Orientation tools while in Multi Record mode, place a polarizer over the light sensor. Face the smartphone toward a source of polarized light, such as a computer screen. Rotate the smartphone and observe changes in light intensity through the polarizer while recording the angle.
Challenge Yourself
-
Plot the relationship between light intensity and angle.
Related Resources

Solute Concentration and Color Intensity
What is the relationship between solute concentration and color?
Try This
Using the Color Detector tool, measure the HEX values of various known concentrations of copper sulfate in an aqueous solution. Convert the HEX values to HSV (Hue, Saturation, Value) using an online converter. Plot mass of dissolved copper sulfate versus hue, and develop a mathematical model to describe the relationship.
Challenge Yourself
-
Determine the concentration of an unknown amount of copper sulfate based upon its hue value.
-
Determine what will happen to the relationship after the saturation point has been reached.
Related Resources

Beer's Law
What is the relationship between SOLUTE CONCENTRATION and LIGHT ABSORPTION?
Try This
Using the Light Meter tool, measure the light intensity as it passes through various cuvettes filled with different known concentrations of colored soda (or other solute). Plot absorbance (as measured by log (I0/I), the log of the intensity of light as observed through a control cuvette filled with water divided by the intensity of light observed through a cuvette filled with the solution) versus concentration.
Challenge Yourself
-
Determine the mathematical relationship between absorbance and concentration.
-
What is the meaning of the slope and y-intercept of the linear relationship observed?
Related Resources
-
Article: Colors in your pocket: Smartphone-based spectrometers to investigate the quantum world
-
Webpage: Glen Gilchrist: "Determine the Concentration of an Unknown Sample with Your Smartphone."
Image Credit: Glen Gilchrist

Identifying Permanent Magnets
What kinds of common METALS can be permanent magnets?
Try This
People frequently confuse permanent magnets with non-magnetic materials that can be polarized by a nearby permanent magnet.
Collect a number of metallic objects from around the house. Using the Magnetometer tool, determine which materials are magnetic and which materials are not. (Note: Because the phone produces a magnetic field itself, even non-magnetic materials moved near the mobile device might interfere with the field and given a false impression that the item is magnetic. For the best result, hold the object steady, and compare with the magnetic field recorded by the mobile device when no object is present).
Challenge Yourself
-
What kinds of metals seem to make up permanent magnets?
-
Can you ever get the mobile device to record a magnetic field of 0 in all directions? Why or why not?
Related Resources
-
Video: Magnet scavenger hunt 2020

Magnetic Field Intensity
What is the relationship between the MAGNETIC FIELD STRENGTH and the DISTANCE from a magnetic "point source"?
Try This
The strength of a magnetic field is dependent upon the distance between the sensor and the "point-source" of the magnet. Using the Magnetometer tool, record the magneti field at various distances away from a strong but small permanent magnet.
Challenge Yourself
-
Create a graph of Magnetic Field Strength vs. Distance from the magnet, and derive a mathematical expression for this relationship.
-
If there are any constants in this mathematical expression, explain their significance.
-
Try performing the same experiment above, but use a fairly large, strong bar magnet. How does the graph of the magnetic field strength compare to before? Why might the nature of the relationship be different?
Related Resources
-
Physics Education. "Measurement of the Magnetic Field of Small Magnets with a Smartphone: A Very Economical Laboratory Practice for Introductory Physics Courses."
-
Mobile Science Wiki. "Magnetic Field Strength"
-
* Note: The lesson plan above refers to a "Mobile Science Magnetic Field" app, and is no longer available. However, this lab can be fully completed with Physics Toolbox Magnetometer alone and/or with any data analysis tool that can accept .csv files. Essentially, the app, developed by Forinash and Wisman, used Physics Toolbox Magnetometer to directly export data into a data analysis tool. Vieyra Software hopes to soon have direct data analysis capabilities in the future.*

Magnetic Poles
Where are the POLES of a bar magnet? A horseshoe magnet? A spherical or irregular magnet?
Try This
Acquire a collection of regular and irregularly-shaped strong magnets. Use the Magnetometer tool to determine where the poles of the magnets are. You might be surprised to find where they are located!
Challenge Yourself
-
Using data from the surface of the magnet, attempt to sketch the magnetic fields lines produced by each type of magnet.
-
Acquire a refrigerator magnet. How does the magnetic field of the "front" face compare to the "back" face of the magnet? Where are its poles located?
Related Resources

Earth's Magnetic Field
Which way does the EARTH's MAGNETIC FIELD point at my latitude and longitude?
Try This
Using the Magnetometer tool, determine the strength of the Earth's magnetic field in three dimensions. Using an understanding of vectors, determine the direction of the Earth's magnetic field.
Challenge Yourself
-
Share magnetic field values with students across the globe, noting respective latitude and longitude values.
-
Create a vector array of magnetic field values to observe the Earth's whole gravitational field.
-
Collect data over time, and observe changes in the Earth's magnetic field due to solar activity.
Related Resources

Planetary Magnetism
What do magnetic fields look like around planets?
Try This
Using the Magna-AR setting that makes use of the magnetometer, accelerometer, and gyroscope, visualize the Earth's magnetic field and explore a model "Earth" and a model "Planet X." Learn about the implications of planetary magnetism on human life.
Related Resources
-
Teacher Guide: Planetary Magnetism Science
-
Student Worksheet: Planetary Magnetism Science
-
Digi Kit: Planetary Magnetism Science
-
Learn more about Magna-AR on our Project Page

Energy in Magnetic Fields and Solar Flares
Where does energy "go" when magnets and their fields interact?
Try This
Using the Magna-AR setting that makes use of the magnetometer, accelerometer, and gyroscope, visualize how fields change when magnetic poles are brought together. Read about the implications magnetic field energy has for how stars release energy into space.
Related Resources
-
Teacher Guide: Energy in Magnetic Fields and Solar Flares
-
Student Worksheet: Energy in Magnetic Fields and Solar Flares
-
Learn more about Magna-AR on our Project Page

Electromagnetism and the Oersted Effect
What is the relationship between CURRENT and MAGNETIC FIELD deflection?
Try This
Using the Compass tool, place a wire across the top of the compass, along the "North-South" direction. Send a variable current through through the wire using a series of batteries or a power source. Observe what happens to the compass when the current is traveling through the wire.
Related Resources
-
Student worksheet from Vieyra Software Electromagnetism

Electromagnetism and Helmholtz Coil
What is the relationship between CURRENT and MAGNETIC FIELD magnitude in three dimensions?
Try This
Using the Magnetometer tool, place the smartphone inside of a Helmholtz coil attached to a power source. Measure the magnetic field strength as a function of current in the coil.
Related Resources
Electromagnetism and the Bio-Savart Law
What is the value of PERMEABILITY OF FREE SPACE?
Try This
Evaluate the Bio-Savart Law by taking a smartphone while recording Magnetometer and Accelerometer data by mounting it on a cart on a frictionless track through a current-carrying coil of known numbers of turns, radius, and current.
Challenge Yourself
-
Double integrate the accelerometer data after export as a .csv to determine the position of the smartphone with respect to the center of the coil.
-
Create a graph of magnetic field strength, B, versus position with respect to the center of the coil, y.
-
Modify the graph to linearize the data. (i.e., plot B^(-2/3) versus y^2.)
-
Determine permeability of free space using the known Bio-Savart Law.
Related Resources
-
Martin Monteiro Blogspot. "Magnetic field "flyby" measurement using simultaneously magnetometer and accelerometer."

Binary Messages with Light
How can INFORMATION be conveyed via DIGITAL SIGNALS?
Try This
Create a simple message after learning how to convert it to binary code. Use a piece of clear tape or an overhead projector laminate to make a translucent strip, then create bars with masking or electrical tape. Slowly pull the barcode across the light sensor while in Light Meter mode. Observe the shape of the light intensity graph.
Challenge Yourself
-
Make barcodes with a partner. Use the graphs to de-code each others' messages.
Related Resources