Physics Toolbox
por Vieyra Software
LESSONS: Light
The majority of lesson ideas below require minimal resources other than the smartphone, and are relevant to introductory physics in high school and college. However, creative individuals are using smartphone science in more complex ways, with drones, engineering kits, and much more. Follow us on Twitter @PhysicsToolbox and see our Publications page for additional content.

Color by Addition
What do projected COLORS of light look like when mixed?
Try This
Using the Color Generator tool on two or three mobile devices, try mixing light by shining the screens in a darkened room onto a white surface. Mix projected red and blue, red and green, blue and green, and red/blue/green. Describe how these mixed colors are different from mixing pigments.
Related Resources
-
Student worksheet from Vieyra Software Color by Addition
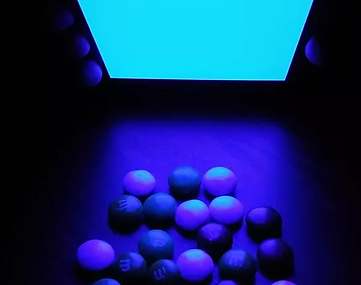
Color by Reflection
What do PIGMENTED OBJECTS look like under monochromatic lights?
Try This
The color of light sources influences the way we perceive objects. For example, if the sun was truly only pure yellow, we would only see the world in shades of yellow! The fact that we can see objects of a full rainbow of colors suggests that the sun, is, indeed, producing the full visible spectrum of light.
Use the Color Generator tool to produce a single color of light, such as red. In a completely darkened room, shine the pure red screen down on a set of colored candies, Lego blocks, or beads (simple colors work best, such as red, blue, green, and yellow). Attempt to sort the items into similarly-colored groups. Then, turn on the ambient light and see how successful you were! Mix up the candies, and try again with pure blue and green, and then secondary colors of light (yellow, magenta, and cyan). Keep track of which colored candies are easiest to sort under which colors of light, and come up with a potential explanation for why this is the case.
Challenge Yourself
-
Complete the student worksheet listed in "Resources" below.
-
Attempt to predict the colors that a given color of candy will appear to your eye when observed under a specific color of light.
-
Using a print-out of the South African flag, sketch what you expect the flag will look like under white, red, blue, green, yellow, magenta, and cyan light.
Related Resources
-
Rebecca Vieyra. "M&M's Color Sorting Lab."
-
Bree Barnett-Dreyfus: "Color Subtraction: Reflected Color"

Light Intensity
What is the relationship between the LIGHT INTENSITY and DISTANCE from a point source of light?
Try This
In a completely darkened room, create a light source by turning on the flash on one mobile device. Record the light intensity with another mobile device by using the Light Meter tool. Using a meter stick, measure how the light intensity changes as a function of distance from the light source.
Challenge Yourself
-
Create a graph of Light Intensity vs. Distance from the light source, and derive a mathematical expression for this relationship.
-
If there are any constants in this mathematical expression, explain their significance.
-
How would this experiment be different if the light source was bigger or brighter/dimmer? Explain.

UV Absorption
Do my sun glasses actually block out UV light?
Try This
Acquire one or more sets of sunglasses that are rated to block out UV light. Using the UV tool, determine compare the UV reading outside under the sky, versus the UV reading when covered by a single lens of the sunglasses. Determine what percentage of UV is blocked by the glasses. Using sunglasses without UV protection, determine if any UV is blocked at all.
Challenge Yourself
-
Compare UV readings of the sky at various times throughout the day.
-
Compare UV readings under clear or overcast sky when the sun is at the same height. Do clouds block UV light?

Color by Subtraction
What colors of LIGHT get absorbed by various FILTERS?
Try This
Although it is common for people to believe that light is "colored" when passing through a filter, this is not the case. It is more effective to think about colors as getting absorbed through filters (considering that white light is a combination of many colors).
Using the Color Generator tool, place a variety of primary colored gummy candies on the screen of a single color. Observe which gummy candies, acting as filters, allow which colors to get through. After describing a working model for how different primary colors of light absorb or are transmitted, predict what colors will be observed through the gummy candies for a screen that produces secondary light.
Challenge Yourself
-
Predict what colors of light will be observed through a gummy candy that appears to be a secondary color of light (i.e. yellow). Explain how you came to your conclusion, and the test it to check.

Seasons and Flux
What causes the seasons?
Try This
Use the Light Meter to model flux experienced at various points on the surface of the Earth. Prepare a globe with an equator, and hold at an angle with respect to a parallel sun or light source. Observe changes in the light intensity experienced by the smartphone, held tangent to the surface, in the north and south hemispheres.
Challenge Yourself
-
For an earth and the light source both in a plane parallel to the "ground," plot the relationship between latitude and light intensity.
-
Explain how this graph would look different if the globe was titled differently (i.e. if the equator was always parallel to the sun, or if the equator was vertical to the ground).
Related Resources

Albedo
How does light REFLECTION and ABSORPTION influence CLIMATE CHANGE?
Try This
Use the Light Meter tool to compare the reflectivity of various types of surfaces representative of different types of ground cover: snow, water, vegetation, sand, etc.
Challenge Yourself
-
Predict which types of ground cover produce greater reflectivity.
-
Consider how ground cover might change if the Earth were to heat up or cool down, and what effect this would have on albedo and environmental feedback loops.
-
Using a more specialized app such as Albedo; A Reflectance App, and a gray card, perform more detailed analyses of specific reflectivities of red, blue, and green light.
Related Resources
-
Alfonso D'Ambrosio: "Global Warming: A Poor Laboratory Activity on Albedo Using a Smartphone" (translate from Italian)
-
Bree Barnett-Dreyfus: "Color Subtraction: Reflected Color"

Eclipses, Transits, and Exoplanet Detection
How do astronomers detect EXOPLANETS?
Try This
Using the Light Sensor tool, model the eclipsing of exoplanets in front of their stars. Use changes in light intensity, as observed from a distance, in order to determine the period of rotation of the exoplanet, its size, and its diameter.
Challenge Yourself
-
How is this model similar to / different from the way astronomers actually identify exoplanets?
Related Resources

Polarized Light and Malus' Law
What is the relationship between LIGHT INTENSITY and ANGLE for polarized light observed through a polarizer?
Try This
Using the Light Sensor and Orientation tools while in Multi Record mode, place a polarizer over the light sensor. Face the smartphone toward a source of polarized light, such as a computer screen. Rotate the smartphone and observe changes in light intensity through the polarizer while recording the angle.
Challenge Yourself
-
Plot the relationship between light intensity and angle.
Related Resources

Solute Concentration and Color Intensity
What is the relationship between solute concentration and color?
Try This
Using the Color Detector tool, measure the HEX values of various known concentrations of copper sulfate in an aqueous solution. Convert the HEX values to HSV (Hue, Saturation, Value) using an online converter. Plot mass of dissolved copper sulfate versus hue, and develop a mathematical model to describe the relationship.
Challenge Yourself
-
Determine the concentration of an unknown amount of copper sulfate based upon its hue value.
-
Determine what will happen to the relationship after the saturation point has been reached.
Related Resources

Beer's Law
What is the relationship between SOLUTE CONCENTRATION and LIGHT ABSORPTION?
Try This
Using the Light Meter tool, measure the light intensity as it passes through various cuvettes filled with different known concentrations of colored soda (or other solute). Plot absorbance (as measured by log (I0/I), the log of the intensity of light as observed through a control cuvette filled with water divided by the intensity of light observed through a cuvette filled with the solution) versus concentration.
Challenge Yourself
-
Determine the mathematical relationship between absorbance and concentration.
-
What is the meaning of the slope and y-intercept of the linear relationship observed?
Related Resources
-
Article: Colors in your pocket: Smartphone-based spectrometers to investigate the quantum world
-
Webpage: Glen Gilchrist: "Determine the Concentration of an Unknown Sample with Your Smartphone."
Image Credit: Glen Gilchrist

Binary Messages with Light
How can INFORMATION be conveyed via DIGITAL SIGNALS?
Try This
Create a simple message after learning how to convert it to binary code. Use a piece of clear tape or an overhead projector laminate to make a translucent strip, then create bars with masking or electrical tape. Slowly pull the barcode across the light sensor while in Light Meter mode. Observe the shape of the light intensity graph.
Challenge Yourself
-
Make barcodes with a partner. Use the graphs to de-code each others' messages.
Related Resources