Visualizing Magnetic Fields in 3-D
- Feb 1, 2019
- 4 min read

Magnetic (and electric) fields are often challenging to teach and understand because they exist in three dimensions. Typical introductory science textbooks will usually present only 2-D images, and one of the first experiences children have with magnets usually involves dropping iron filings over a 2-D paper sheet placed on top of a bar magnet.

More adventurous teachers might encourage their students to see the 3-D fields by directly dipping a strong magnet into the iron filings or making a magnetic field bottle composed of oil and iron filings so that the field of a magnet placed on the surface of the bottle can be visualized inside of the bottle. One particularly fun approach is to submerge a magnet into liquid gelatin that has been mixed with iron filings. The result will be half of a visualized magnetic field that can be sliced and diced to view cross-sections. Rebecca's personal favorite as a teacher, however, was to play with ferrofluid, a topic that has become all the rage on YouTube.

While most people will study magnetic fields that include the traditional bar or horseshoe magnet, producing symmetrical fields, people often fail to understand how magnetic fields interact or look different from various vantage points. The reality is that magnetic fields are not symmetrical in many situations that matter in a practical sense. The Sun often produces coronal mass ejections, flares, and multiple and dynamic post-flare loops of plasma. As the plasma churns and moves, it produces magnetic aberrations. Overall, this activity influences the Earth's magnetosphere, and can pose technological and biological risks to humans as it interacts with the protective layer of our own planet's magnetic field. The world has a small army of very important scientists who follow these space weather changes, including NASA and NOAA/NWS.
Despite its importance, students' visuospatial abilities, including their ability to rotate objects in 3D, are often limited. A seminal 1978 paper by Vandenberg and Kuse concluded that boys' visuospatial abilities were superior to those of girls, a finding that has since been confounded or sometimes refuted when other factors were included in the analysis, such as speed of response and number of guesses. Further, some researchers believe that even if differences do exist, they are not necessarily biologically inherent, might be dependent upon the question context (when comparing regular test questions and more practical everyday experiences), and can be overcome through exposure and training. Curious to test your own skills? You can try an online mental rotations test (be sure to click on the button below the black space in order to begin).

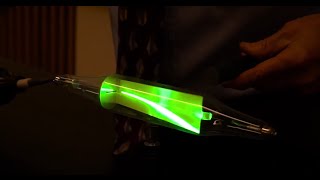
In our NSF-funded project, we've finally been able to make our biggest breakthrough by linking magnetic sensor data to physical points in space using AR. In this series of images on our kitchen table, we show how AR can serve to help individuals visualize fields and see them from multiple perspectives. Below, you can see multi-colored spheres. These spheres represent the prior location of the smartphone as it was moved in space toward the column of stacked magnets (equivalent to a bar magnet). On a static image, it appears as though these spheres are located primarily along the x-axis, but in reality they show depth. As the magnetic field increased as we moved toward the magnets, the color of the spheres changed from red to green. (While vectors have traditionally been the preferred method to represent fields, we opt to use this simpler approach to start our software development, and, we anticipate that this might also be a more helpful initial representation for some students.)

In the image above, we show a more complex series of collected data. In this case, data was collected in a spiral. (Smartphone users press the red button to collect data, during which time the sensor samples every half second. The density of data in a given space can therefore be controlled by how much the user moves around).
Looking at this above image alone, it might be possible for an astute individual to recognize that this might not be a flat spiral, but more of a conical spiral. A side image, as demonstrated below, shows this to be to be the case.

And, the image below from a slight angle shows a slight different perspective.

We are eager to finalize development of our vector view, which will allow us to show magnitude and direction at the same time. By giving the user control of where data is collected (and, ideally, how it is displayed in terms of data density and visualization type), they will have the ability to explore both the nature of fields and how data collection can influence the model that is developed. Further, it will be exciting to see how it might be possible to extend these visualizations by suspending a magnet, allowing the user to truly map out the field from all vantage points and engage their whole body in learning as they move about the magnet. Soon, our educational research team will begin to explore what impact this has on physics learning and/or visuospatial skills!
This work is funded by NSF Grant #1822728. Any opinions, findings, and conclusions or recommendations expressed in this material are those of the author(s) and do not necessarily reflect the views of the National Science Foundation.