Building a LiDAR-based Position Visualizer—Prototype
- Oct 10, 2021
- 3 min read
Rebecca Vieyra & Chrystian Vieyra (10 October 2021)
If you own an iPhone 12 or 13 Pro/Pro Max, or an iPad Pro 2020/2021, you can soon look forward to using the Motion Visualizer mode within Physics Toolbox. With the support of a collaborative grant from the National Science Foundation with the American Modeling Teachers Association, Arizona State University, and a team of educational researchers and educators, along with a vision to make data literacy accessible to learners, Apple's new front-facing LiDAR turns your device into a veritable 3-D scanner.
With this grant, we hope to get high-precision distance (and motion) measurement. We've broken down the challenge to make a Motion Visualizer into the following pieces:
Determine distance measurement for a single target in the field of view
Use distance information for a single target to plot position and velocity measurements during a period of time
Create a gamified experience to help learners understand position and velocity concepts through graphing
Plot vectors in 3-D space representing the motion of the measuring device
Then, if possible:
Determine the distance measurement for multiple targets in the field of view
Plot vectors in 3-D space representing the motion of object(s) moving in the field of view
Integrate these features into the gamified experience
One of the major challenges that independent software developers encounter is hardware information is typically undisclosed. In the case of our project, we needed to better understand the nature of LiDAR's infrared array and how it is situated with respect to the field of the view of the camera. Using an Oculus Quest, which displays infrared beams as visible light on the headset, we observed what appear to be two flashing, nearly overlapping arrays with 12 x 12 points of light. Apple discloses a minimal amount of information about how their algorithm uses information from the infrared array to create a depthMap, in which each depthMap pixel corresponds to a distance measurement. LiDAR-enabled devices also provide an associated confidenceMap to help filter out less precise data.

To better explore the actual capabilities, we performed a few tests with the depthMap, which can fairly easily be rendered. The images below illustrate the camera images and corresponding depth map for two objects, a small box and a ring of duct tape. Notably, very thin objects, such as the ring of duct tape, do not appear on the depth map despite protruding from the wall approximately 5 centimeters (significantly more than the hand in the picture.


Although the infrared array is composed of only 12 x 12 rays of light, data output for the depthMap comes in a 256 x 192 pixel matrix. (We anticipate that the depth map is composed of 144 points, but that the actual data presented to the developers is interpolated—but we do not know why the data output would be more along one axis of the matrix than the other). Data is sampled at 60 Hz.
Despite our continued uncertainty about the correspondence of the depthMap data to the points on the camera screen, we were able to isolate the centermost data, which would correspond to the center of the camera regardless of aspect ratio of the depthMap or the displayed camera:
var centerDepth = readDepth(from: depthMap, at: CGPoint(x: pixelBufferWidth * 0.5, y: pixelBufferHeight * 0.5), baselineWidth: pixelBufferWidth)
Our first Motion Visualizer prototype makes use of only the central LiDAR data point. We have superimposed onto the camera screen a central target, as well as the reading of position, x, and velocity, v (calculated as Δx/Δt). Initially, position readings changed too quickly to make sense of them visibly, so we applied a moving average over each 10 data points, reducing the sampling frequency to 6 Hz. Lower precision values (based on confidenceMap) display in yellow (medium confidence) or red (low confidence).
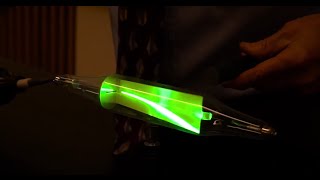
Take a look at the video below to see a prototype of the Motion Visualizer!
Moving forward, we hope to soon add position and velocity graphs, as well as a set of gamified graph-matching tasks, in which users must match pre-determined graph shapes. The user's motion will be assessed for accuracy using a coefficient of determination (figure 1a). Building off of Magna-AR's capabilities, we hope to be able to have users plot motion vectors representing position and relative velocity at various points throughout their path, then to allow them to step back and view those vectors (figure 1b).

If you have Physics Toolbox Sensor Suite on your modern iOS device, keep your eyes open for an update in the near future! Curious to learn more? Reach out to the developers at support@vieyrasoftware.net
This work is funded by NSF Grant #2114586. Any opinions, findings, and conclusions or recommendations expressed in this material are those of the author(s) and do not necessarily reflect the views of the National Science Foundation.